| . |  |
. |
Greenbelt MD (SPX) Sep 21, 2006 How can one know how much rain really falls over the path of a tropical storm or hurricane? This is a question that greatly interests meteorologists and hydrologists. On their behalf, and on behalf of the public which ultimately benefits from better observations of storms, NASA scientists are using satellite data from its rain gauge in space, the Tropical Rainfall Measuring Mission or "TRMM" to help provide these measurements. TRMM, a joint mission between NASA and JAXA, the Japanese Space Agency, was launched in 1997 to study rainfall in the tropics. Since then, researchers and forecasters have found TRMM invaluable. TRMM has provided rainfall data in places that have no rain gauges, as well as lightning data and a never before seen 3-D look into storms. That 3-D capability has also led scientists to formulate a theory on "Hot Towers," or towering clouds that form in the eyewall of a hurricane. Currently, scientists are using TRMM data to provide a complete picture of precipitation around the entire world. Goddard scientists Bob Adler and George Huffman are compiling this information using TRMM, as well as data from NASA's Aqua satellite, a few Department of Defense satellites, a few National Oceanic and Atmospheric Administration polar-orbit satellites, and five international geostationary-orbit satellites. Polar orbiting satellites fly over the north and south poles. Geostationary satellites are those that orbit the Earth in a fixed position over the Equator. This combination of satellite data allows Adler and Huffman to compute how much rain has fallen over three hour periods for most of the world, not including the upper northern and lower southern hemispheres. Huffman said "Data from TRMM are key to getting the complete picture of rainfall around the world, because of the satellite's high quality sensors and special orbit." Adler and Huffman take advantage of these attributes to adjust each of the other satellite data sets to TRMM's rainfall data. NASA uses these TRMM Multi-satellite Precipitation Analysis data to create maps of rainfall accumulation along the tracks of hurricanes. These images show the mapped rainfall for 2006's Hurricane Ernesto in the Atlantic Ocean, Super Typhoon Ioke in the Central Pacific Ocean, and Hurricane John in the eastern Pacific Ocean.
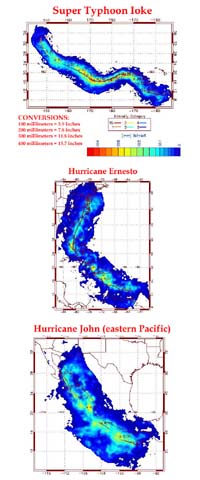
Hurricane Ernesto's Rainfall Track This image (right) shows the amount of rain that fell from Hurricane Ernesto from Aug. 24, 2006 at 5:00 p.m. EDT (21 UTC) to 5:00 p.m. EDT (21 UTC) on Sept. 1. Click to enlarge. The rainfall is accumulated within approximately 410 miles (a radius of 6 degrees) from the storm's center along the track. The track line is superimposed on the rainfall, with the storm intensity indicated by the color of the line. For the most part, Ernesto was a tropical storm (red line) and became a category one hurricane on the Saffir-Simpson scale on Aug. 28, south of Hispanola. The month and day are indicated along the track. For example, "8/28" is Aug. 28, 2006. A significant disruption of the storm's rainfall occurred as the storm moved over Cuba, likely contributing to Ernesto's inability to intensify. Despite its modest intensity, Ernesto dumped large quantities of rain on the East Coast. For example, eastern North Carolina recorded 8 to 12 inches of rain, while southeastern Virginia measured up to a foot. Seven inches fell in Worcester County on Maryland's Eastern Shore. Notice how the accumulations estimated from the TRMM data approximately match these reports.
Super Typhoon Ioke's Track This image (left) shows the amount of rain that fell from Supertyphoon Ioke for the period from Aug. 19 at 1:00 p.m. EDT (17:00 UTC) to 8:00 p.m. Sept. 4, (00:00 UTC) Sep. 5. Click to enlarge. The rainfall is accumulated within approximately 410 miles (a radius of 6 degrees) of the storm center following the track. The track is superimposed on the rainfall, with the storm intensity indicated by the color of the line (see legend). The month and day are indicated along the track. Intense precipitation occurred as Ioke spent approximately 8 days at Category 4 and 5 intensity. The rainfall on the day Aug. 29 is estimated by TRMM to be between 120-140 millimeters (4.7 inches- 5.5 inches) as depicted in orange/red in the image. Ioke was a very long-lasting intense storm. The image shows that the rain accumulation exceeded 80 millimeters once the storm reached Category 4 intensity and stayed above that value for about 7 days. On Sept. 1, the rainfall began to diminish and a day later the storm's intensity began to decrease.
Hurricane John Slammed Baja California This image (right) shows the amount of rain that fell from Hurricane John from Aug. 28 at 11:00 a.m. EDT (15:00 UTC) to Sept. 4 at 8:00 a.m. EDT (12:00 UTC). Click to enlarge. The rainfall is accumulated within approximately 410 miles (a radius of 6 degrees) of the storm center following the track. The track is superimposed on the rainfall, with the storm intensity indicated by the color of the line. For example, for most of the day on Aug. 30, the track line is cyan or light blue, indicating at that time, that John was a Category 3 storm on the Saffir-Simpson scale with winds between 111-130 mph. The month and day are indicated along the track. On Tuesday, September 5, much of the southwestern United States was under clouds and rain as the remnants of John moved closer to the region. The normally dry region of southern New Mexico got enough rain to cause isolated road flooding, John's remnants brought southern Arizona scattered rain. Related Links See NASA story for detailed images and captions A world of storm and tempest Bring Order To A World Of Disasters SpaceDaily Search SpaceDaily Subscribe To SpaceDaily Express |
|
| The contents herein, unless otherwise known to be public domain, are Copyright 1995-2005 - SpaceDaily. AFP and UPI Wire Stories are copyright Agence France-Presse and United Press International. ESA Portal Reports are copyright European Space Agency. All NASA sourced material is public domain. Additional copyrights may apply in whole or part to other bona fide parties. Advertising does not imply endorsement, agreement or approval of any opinions, statements or information provided by SpaceDaily on any web page published or hosted by SpaceDaily. Privacy statement |