| . |  |
. |
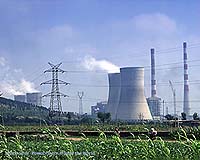
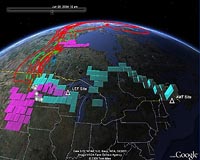
Ann Arbor MI (SPX) Sep 23, 2009 Sometimes a picture really is worth a thousand words, particularly when the picture is used to illustrate science. Technology is giving us better pictures every day, and one of them is helping a NASA-funded scientist and her team to explain the behavior of a greenhouse gas. Google Earth - the digital globe on which computer users can fly around the planet and zoom in on key features - is attracting attention in scientific communities and aiding public communication about carbon dioxide. Recently Google held a contest to present scientific results using KML, a data format used by Google Earth. "I tried to think of a complex data set that would have public relevance," said Tyler Erickson, a geospatial researcher at the Michigan Tech Research Institute in Ann Arbor. He chose to work with data from NASA-funded researcher Anna Michalak of the University of Michigan, Ann Arbor, who develops complex computer models to trace carbon dioxide back in time to where it enters and leaves the atmosphere. "The datasets have three spatial dimensions and a temporal dimension," Erickson said. "Because the data is constantly changing in time makes it particularly difficult to visualize and analyze." A better understanding of the carbon cycle has implications for energy and environmental policy and carbon management. In June 2009, Michalak described this research at the NASA Earth System Science at 20 symposium in Washington, D.C. A snapshot from Erickson's Google Earth application shows green tracks representing carbon dioxide in the lowest part of the atmosphere close to Earth's surface where vegetation and land processes can impact the carbon cycle. Red tracks indicate particles at higher altitudes that are immune from ground influences. The application is designed to educate the public and even scientists about how carbon dioxide emissions can be traced. A network of 1,000-foot towers across the United States is equipped with instruments by NOAA to measure the carbon dioxide content of parcels of air at single locations. The application is designed to educate the public and even scientists about how carbon dioxide emissions can be traced. A network of 1,000-foot towers across the United States, like the tower above, are equipped with instruments by NOAA to measure the carbon dioxide content of parcels of air at single locations. But where did that gas come from and how did it change along its journey? To find out, scientists rely on a sleuthing technique called "inverse modeling" - measuring gas concentrations at a single geographic point and then using clues from weather and atmospheric models to deduce where it came from. The technique is complex and difficult to explain even to fellow scientists. Michalak related the technique to cream in a cup of coffee. "Say someone gave you a cup of creamy coffee," Michalak said. "How do you know when that cream was added?" Just as cream is not necessarily mixed perfectly, neither is the carbon dioxide in the atmosphere. If you can see the streaks of cream (carbon dioxide) and understand how the coffee (atmosphere) was stirred (weather), then scientists can use those clues to retrace the time and location that the ingredient was added to the mix. The visual result typically used by scientists is a static two-dimensional map of the location of the gas, as averaged over the course of a month. Most carbon scientists know how to interpret the 2D map, but visualizing the 3D changes for non-specialists has proved elusive. Erickson spent 70 hours programming the Google Earth application that makes it easy to navigate though time and watch gas particles snake their way toward the NOAA observation towers. For his work, Erickson was declared one of Google's winners in March 2009. "Having this visual tool allows us to better explain the scientific process," Michalak said. "It's a much more human way of looking at the science." The next step, Erickson said, is to adapt the application to fit the needs of the research community. Scientists could use the program to better visualize the output of complex atmospheric models and then improve those models so that they better represent reality. "Encouraging more people to deliver data in an interactive format is a good trend," Erickson said. "It should help innovation in research by reducing barriers to sharing data." Share This Article With Planet Earth
Related Links Michigan Tech Research Institute Climate Science News - Modeling, Mitigation Adaptation
 China pledges to curb emission growth by 'notable margin'
United Nations (AFP) Sept 22, 2009 Chinese President Hu Jintao on Tuesday pledged to curb the growth of China's carbon dioxide emissions by a "notable margin" by 2020 from their 2005 levels. But Hu also did not put a figure on the cuts, telling the UN General Assembly that the curbs would be measured by unit of Gross Domestic Product, in line with China's concerns about preserving its rapid economic growth. "We will ... read more |
|
| The content herein, unless otherwise known to be public domain, are Copyright 1995-2009 - SpaceDaily. AFP and UPI Wire Stories are copyright Agence France-Presse and United Press International. ESA Portal Reports are copyright European Space Agency. All NASA sourced material is public domain. Additional copyrights may apply in whole or part to other bona fide parties. Advertising does not imply endorsement,agreement or approval of any opinions, statements or information provided by SpaceDaily on any Web page published or hosted by SpaceDaily. Privacy Statement |
 del.icio.us
 Digg
Digg Reddit
 YahooMyWeb
 Google