
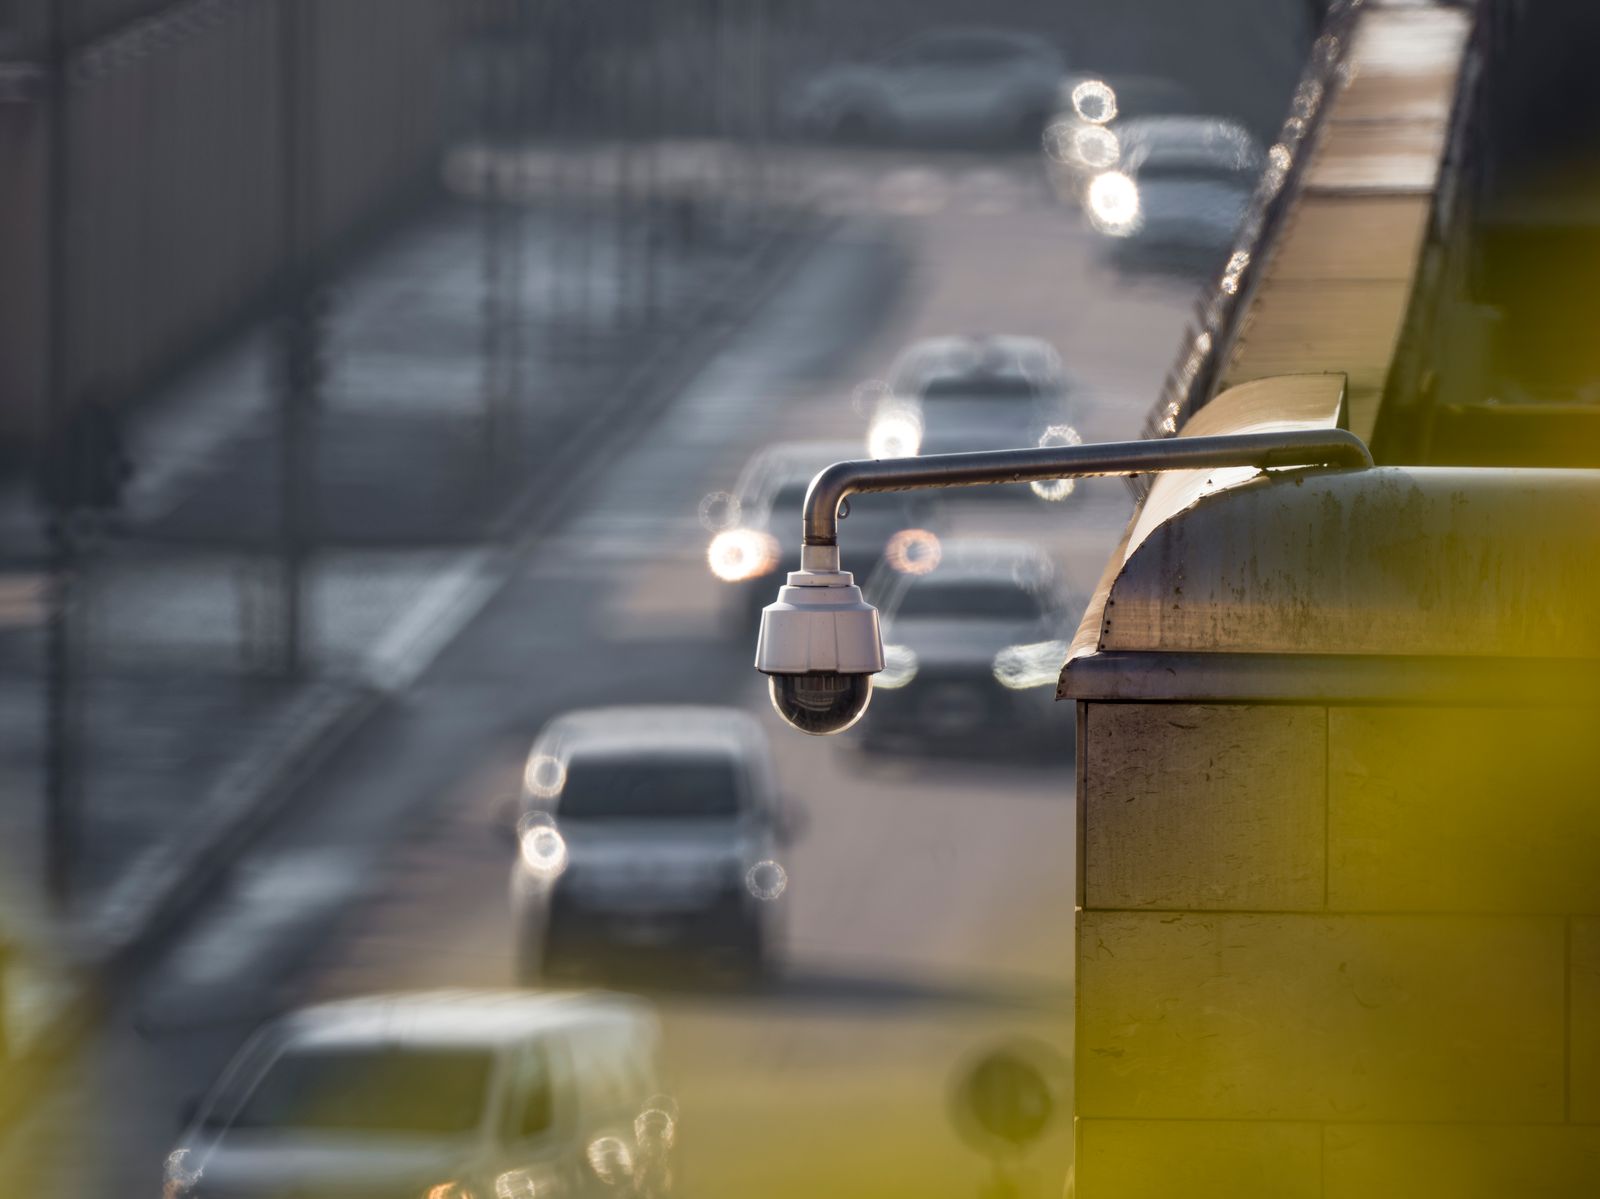
On a stretch of Roosevelt Boulevard in Northeast Philadelphia, multiple lanes of traffic move past row homes and bus stops at speeds that routinely exceed the posted limit by 15 miles per hour or more. That corridor, and roughly a dozen others like it, carry a disproportionate share of the city’s carnage. Speeding factors into about one in five of Philadelphia’s severe crashes, and 80% of the city’s fatal or serious collisions cluster on a network of streets planners call the High Injury Network — the corridors now being retrofitted first with speed cushions, automated cameras, and concrete.
No large American city has a worse record. A City Controller analysis of federal crash data put Philadelphia at 9.04 traffic deaths per 100,000 residents in 2024 — up from 8.64 the year before, and ahead of Chicago at 7.15, Washington at 4.73, Boston at 3.64, and New York at 2.86.
What the High Injury Network actually is
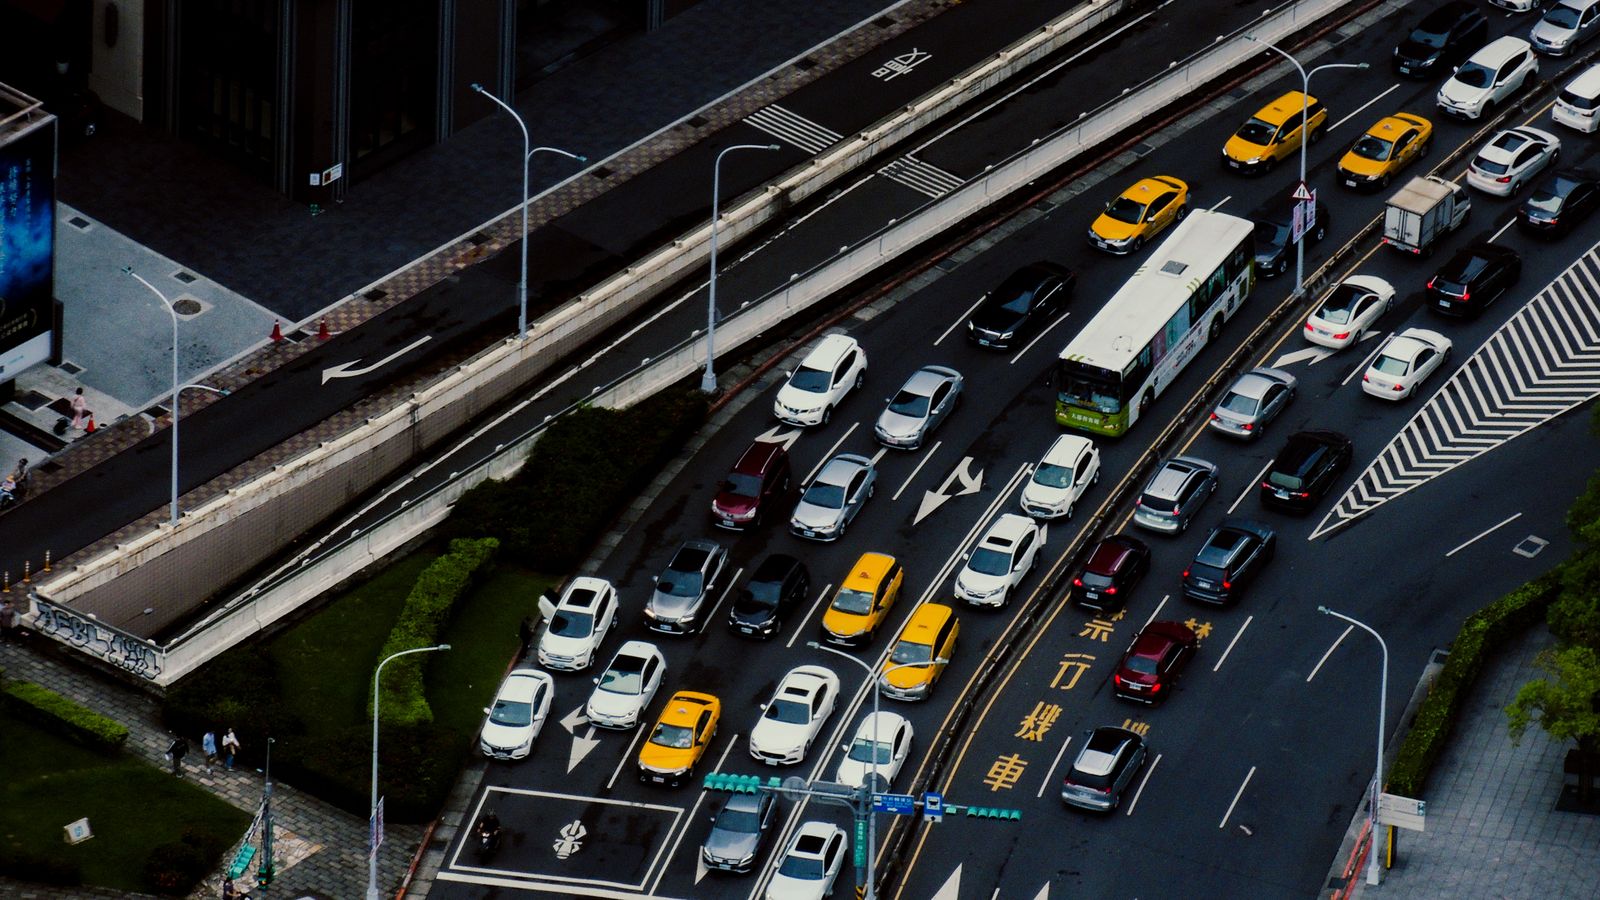
The High Injury Network is not a metaphor. It is a specific, mapped set of streets that Philadelphia’s Vision Zero task force identified by pulling five years of police crash reports and plotting where people died or suffered life-altering injuries. Twelve percent of the city’s street miles carry 80% of its fatal and serious crashes. Those miles are the network, and the Parker administration redrew the map in November 2025 using crash data from 2019 through 2023.
They tend to share a shape: four to six lanes, wide travel lanes designed for the driving speeds of the 1960s, long distances between signalized crosswalks, and commercial frontage that pulls pedestrians across in mid-block. Roosevelt Boulevard is the archetype. Broad Street north of City Hall is another. Aramingo, Cottman, Frankford, Castor, Lehigh, Kensington, Girard — the names repeat in crash logs year after year.
The retrofits have a measurable record. Where the city has completed Complete Streets projects, fatal and serious injury crashes fell 34% and injury crashes of any severity fell 20%, measured against High Injury Network trends. Road diets on their own produced 18% fewer injury crashes. Mayor Cherelle Parker’s fiscal year 2027 budget commits $30 million through the six-year capital program to that work.
Drivers are getting safer. Everyone else is not.
The most striking pattern in the last five years of Philadelphia crash data is a split. Motorist deaths have fallen. Pedestrian and cyclist deaths have not.
An analysis by Philly Bike Action of PennDOT’s updated figures found that a record 55% of people killed in Philadelphia traffic crashes in 2025 were non-motorists — pedestrians, people on bikes or scooters, people in wheelchairs. Serious injuries broke the same way: 52% happened when a driver hit someone outside a car. From 2020 through 2025, overall crashes declined in the city, but non-motorist crashes stayed flat or rose, the group concluded.
Jacob Russell, the Philly Bike Action organizer who ran the review, told the Inquirer that the drop in deaths among people inside vehicles was impressive. On the non-motorist side, he said, you see essentially no change
.
The reasons cars have gotten safer for their occupants are well documented. Airbags, crumple zones, electronic stability control, lane-keep assist, automatic emergency braking. None of those features protect a person standing on a sidewalk when a driver on a phone drifts through a red light at 45 mph.
Pennsylvania as a whole is trending safer. PennDOT reported 1,074 traffic deaths in 2025 — the lowest annual total since the state began keeping records in 1928. Transportation Secretary Mike Carroll called the figure good news while adding that a single death is one too many.
The decline is real. It is also unevenly distributed, and Philadelphia is where the unevenness shows up hardest: the state’s safest year on record was not the city’s.
Why speed is the whole story
Crash physics is unforgiving. Research by Brian Tefft for the AAA Foundation for Traffic Safety put a struck pedestrian’s average risk of death at 10% for an impact at 23 mph, 25% at 32 mph, and 50% at 42 mph. Risk climbs steeply with age: a 70-year-old hit at 25 mph faces roughly what a 30-year-old faces at 35. Kinetic energy scales with the square of velocity, so a driver going 40 delivers four times the impact energy of a driver going 20 — not twice.
Speeding is a direct causal factor in about one in five of Philadelphia’s severe crashes. The share is higher on multi-lane arterials where posted limits sit at 30 or 35 mph but geometry invites 50. Roosevelt Boulevard’s crash record led the state legislature to authorize Pennsylvania’s first automated speed enforcement program there, and the cameras went live in 2020. Since then the city reports speeding violations down roughly 95% at camera locations, fatal and serious injury crashes down 21%, and crashes involving pedestrians down 50%.
The city has since extended camera enforcement to Broad Street, where the limit is 25 mph and cameras sit at 15 intersections from Pattison Avenue north to Old York Road. Between 2020 and 2024 that route recorded 206 fatal or serious injury crashes. Ticketing began in November 2025, after a 60-day warning period.
What speed cushions do that speed bumps do not
The devices Philadelphia has installed are speed cushions, not speed bumps. The distinction matters.
A speed bump is a continuous ridge across the roadway. Every vehicle, regardless of size, has to slow to about 5 mph to cross without jarring impact. That works in parking lots. It does not work on streets that fire engines and ambulances also use, because emergency vehicles lose critical seconds at every bump.
A speed cushion is a bump with gaps cut into it, spaced to match the wheel track of a fire truck. A car, whose wheels are closer together, hits the raised sections and has to slow. A fire engine, whose wheels are farther apart, straddles the gaps and passes through at speed. Cushions typically drop passenger-car speeds to around 20 mph while allowing emergency response times to hold steady.
The city’s Neighborhood Slow Zone Program, which the Parker administration has expanded, lowers limits to 20 mph and concentrates cushions and curb extensions on residential streets, often around schools.
Paint, plastic, and concrete
A crash on Aramingo Avenue in April 2026 illustrates a separate design failure. Glenn Colville Jr., 43, was riding in a marked bike lane protected only by flexible plastic delineator posts — the kind that bend under a car bumper and pop back up. A driver hit him from behind and left the scene.
Russell’s argument, made to the Inquirer after that crash, is that a concrete barrier can stop a vehicle outright or at least bleed off enough energy to make the collision survivable. Plastic cannot do either. The distinction between paint, plastic, and concrete is the distinction between a lane that suggests safety and a lane that provides it.
Hit-and-run rates track loosely with a driver’s calculation about consequences. Longer police response times, unlit stretches of arterial, and low expectations of witness identification all raise the odds a driver flees. The city’s LED streetlight replacement program was pitched partly as a safety measure for exactly this reason.
What comes next on the network
The 80% figure — the share of severe crashes on 12% of street miles — is what makes the High Injury Network approach possible at all. If serious crashes were evenly distributed across every residential block, the city would need to reengineer roughly 2,500 miles of roadway. Instead it needs to reengineer a few dozen corridors. That is expensive but tractable, and the $30 million capital allocation will not cover all of it. It will cover the intersections where crash density per block is highest.
The math of Vision Zero is not the math of eliminating every crash. It is the math of eliminating fatalities and serious injuries by driving down the speeds at which crashes happen — narrowing lanes, shortening crossings, and taking away the geometric permission to accelerate.
Washington Avenue is the proof of concept the city keeps pointing to. Its road diet — a reduction from four lanes to three with a center turn lane and bike lanes — went in over multiple years of contentious community meetings between 4th and Broad, and the corridor now sits inside the category of projects the city credits with 18% fewer injury crashes.
Roosevelt Boulevard is the harder problem. It functions as a de facto highway despite being a signalized surface street, and PennDOT’s long-planned rebuild would separate through traffic from local traffic and add transit lanes. The price runs into the billions and depends on federal and state contributions that shift with each administration.
The 2026 crash data will be the first full accounting under the new capital commitment. If the non-motorist share of fatalities stays at 55%, the diagnosis has not changed. If it drops, the concrete and the cameras and the cushions on those corridors will be the reason.
Roosevelt Boulevard will be exactly as wide tomorrow morning as it is tonight. The row homes will still sit a few dozen feet from lanes of traffic moving well past the posted limit, the bus stops will still be islands in the middle of it, and someone will still cross where the road was never designed for them to cross. What the cushions and the cameras and the concrete change is not the geometry. It is the speed the geometry is allowed to produce — and at 20 mph instead of 40, whether the person crossing gets an ambulance or a medical examiner.
