
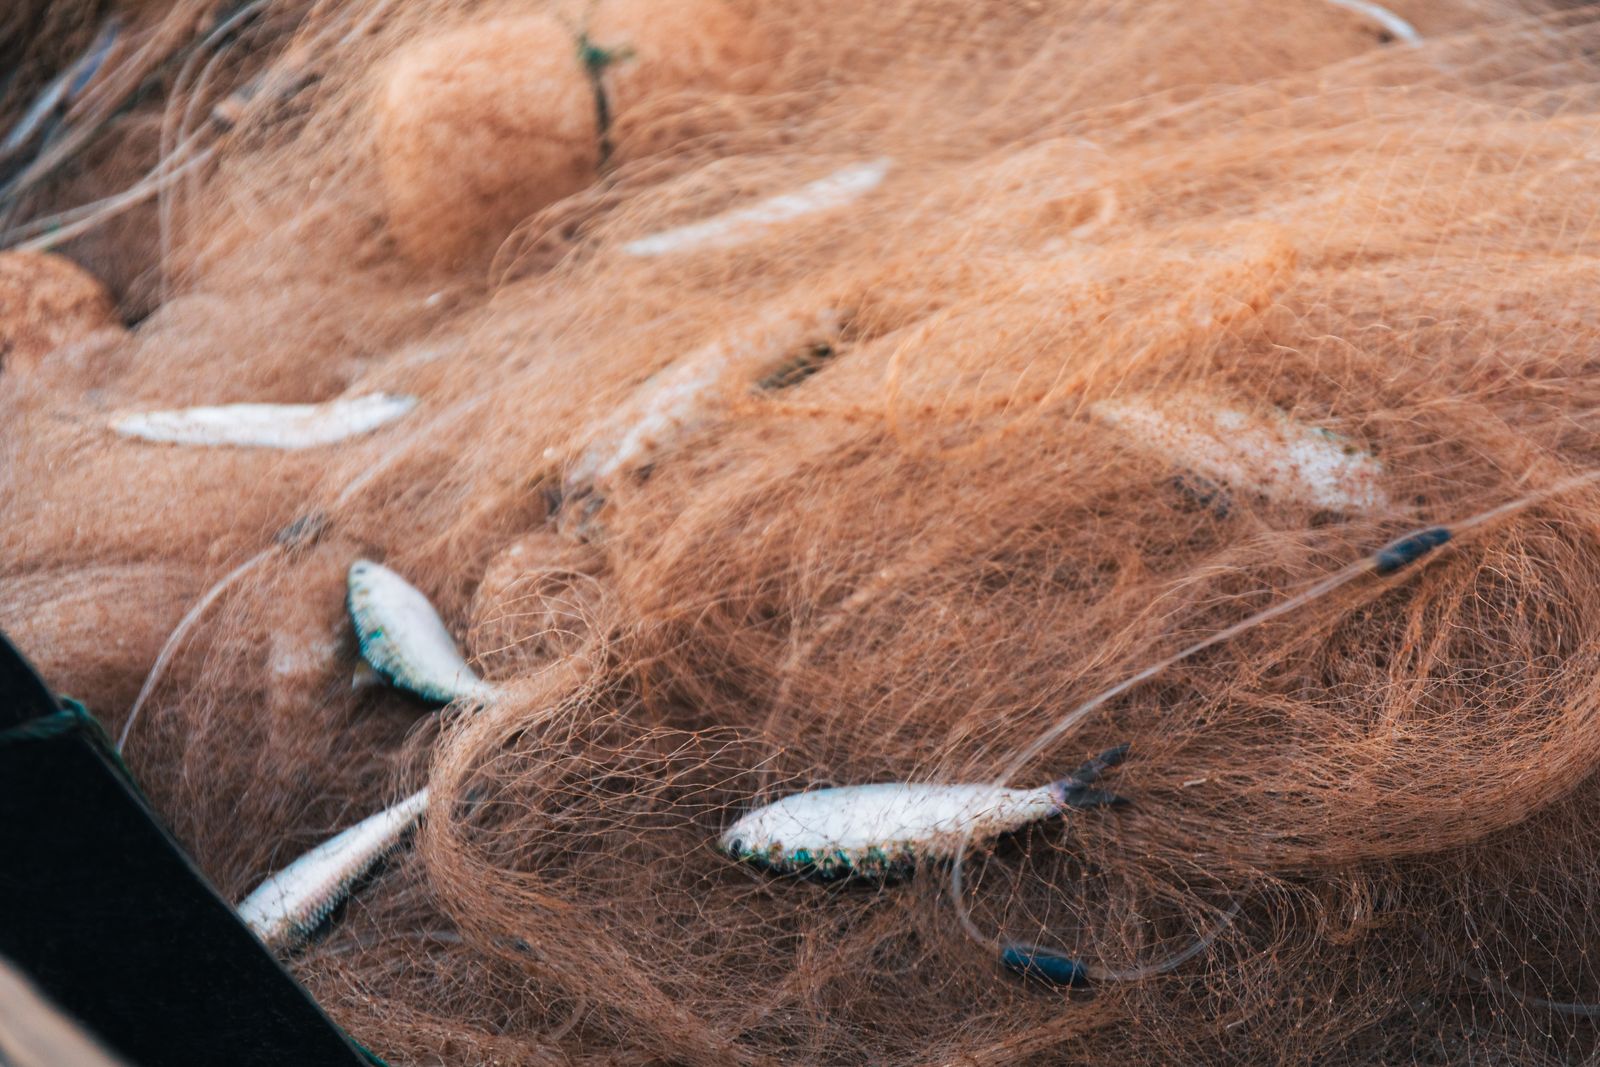
On each standard tow, a roughly 20-foot net drags the bottom of the Chesapeake Bay for exactly five minutes. The crew sorts the catch, identifies and measures the fish, and returns them to the water, while also recording depth, salinity, dissolved oxygen, temperature and weather. The procedure is brief, but the record behind it reaches back to 1955.
William & Mary describes its Juvenile Finfish Trawl Survey as one of the longest continuously running fish surveys in the United States. The program now monitors more than 1,200 sites each year across the lower Chesapeake Bay and its tributaries, creating repeated snapshots of young fish populations.
The rule is consistency, not stasis
The power of a long ecological record comes from keeping its measurements comparable. That does not mean literally changing nothing. VIMS has changed vessels, expanded its sampling area, added a tickler chain to the trawl in 1973 and introduced electronic measuring boards in 1988, but it has documented those changes while preserving a standard five-minute tow.
“The basic point of the survey is to monitor juvenile fishes over time and use consistent methodologies so we can compare one year to the next in perpetuity,” senior research scientist Troy Tuckey said. “Nature doesn’t respond in a year, so you need a long-term perspective.”
The present schedule is more complicated than a single monthly trip. According to the official survey methods, crews sample 22 stations in the James, York and Rappahannock rivers each month throughout the year. They also sample 39 to 45 Bay stations in most months, with no Bay sampling in January or March.
After each tow, fish are identified and measured before being returned to the water; when a catch is very large, a subset is measured and the remainder counted. About 70 species are commonly caught, while more than 200 species have been identified over the past 50 years. The counting is visible, but the controlled duration, recorded location and environmental readings are what make one catch comparable with another.
From the York River to the lower Bay
The survey began in spring 1955 with stations spaced at roughly five-mile intervals along the York River. Sampling was irregular during that first year, then became almost continuous from April through November beginning in April 1956. That distinction matters because the record is long, but neither its geographic reach nor its calendar has been frozen since its first season.
Sampling began on the Rappahannock River in 1962 and on the James River in 1964. Regular coverage of the Virginia portion of Chesapeake Bay followed in 1988. The result is a record that grew from a line of York River stations into a regional survey of three tidal rivers and the lower Bay.
The survey’s central products are indices of abundance, which estimate the relative strength of each year class rather than attempting to count every fish in the estuary. VIMS says those indices help show whether annual recruitment succeeded and help managers anticipate future stock abundance. The program’s data products also include reports, publications, theses and interactive data.
Those measurements feed fishery management rather than replacing it. The VIMS survey overview says the data are used with other surveys by the Virginia Marine Resources Commission and multi-state fisheries councils when they develop management plans. A juvenile fish tipped onto a wet sorting table can therefore become one observation inside a much larger stock assessment.
What seven decades of counting can reveal
A five-minute tow is a small event. Repeating a standard tow across seasons and decades can reveal changes too slow or noisy to see in a single field season, including shifts in distribution, recruitment and the mix of species present.
Mary Fabrizio, a professor at William & Mary’s Batten School of Coastal & Marine Sciences & VIMS, said the survey has recorded fish responses to climate change as well as the arrival and spread of invasive species. The same record also captured white shrimp moving north into warming Bay waters and helped support the opening of a commercial shrimp fishery in Virginia.
Blue catfish present the harder case. Virginia introduced the species into tidal rivers during the 1970s to create a recreational fishery. As blue catfish became established, survey records showed a correlated decline in native white catfish occupying similar habitat, while white perch catches also fell sharply.
The pattern is not uniform across the watershed. VIMS researchers report that blue catfish remain on the rise in the York River but appear to have plateaued at high levels in the James and Rappahannock. Long-term monitoring can expose those different trajectories, although correlation in a trawl record alone does not prove which combination of predation, competition and habitat change produced them.
Virginia has also changed its harvest rules in response to the invasion. Commercial electrofishing rules effective March 1, 2025 expanded licensing and harvest areas for nonnative catfish. The approach uses low-frequency electrical current to immobilize blue and flathead catfish for harvest under tightly defined gear, season and reporting restrictions.
The blue crab record needs its own survey
Blue crabs appear in the finfish trawl, but the Bay-wide population estimate comes from a different program. The Winter Dredge Survey has been conducted cooperatively by Virginia and Maryland since 1990 and samples about 1,500 sites each winter. Keeping the two surveys distinct matters because they use different gear, seasons and sampling designs.
In 2026, the Winter Dredge Survey estimated 349 million blue crabs, up 46% from 238 million in 2025. Juvenile abundance rose 121% to 228 million and adult males increased 25% to 37 million, while adult females fell 25% to 81 million. The female estimate remained above the 72.5-million overfished threshold but far below the 196-million management target.
One strong juvenile year does not settle the longer decline. The 2026 Chesapeake Bay blue crab stock assessment found that blue catfish may have reduced blue crab recruitment by about 8% in the most recent period it analysed, while the estimated effect was below 5% across most of the time series. The assessment did not identify a primary cause for the long-term recruitment decline.
A separate peer-reviewed study of the lower James River found year-round predation concentrated on juvenile blue crabs. For 2018 to 2020, the researchers estimated that blue catfish removed about 564,365 juvenile crabs annually from that study area. It is a substantial local estimate, not a count for the entire Chesapeake Bay.
Habitat adds another layer. Juvenile crabs use submerged grass as cover, and earlier work on dense seagrass beds shows why the structure of those meadows can affect survival. Predators, fishing, winter cold, food and habitat can move together, which is why managers rely on several long-running data sets instead of a single number.
The habitat is moving too
The species mix is not the only part of the Bay changing. A 2023 analysis combined 35 years of water-quality and watershed data with aerial surveys across 26,000 hectares of seagrass habitat. The study found a 54% contraction of eelgrass since 1991 and a 171% expansion of widgeongrass, making the more heat-tolerant species dominant.
That replacement trades one kind of resilience for another. Widgeongrass can recover quickly after disturbance, but it has also produced the largest seagrass crashes of the past four decades and is vulnerable to nutrient pulses after heavy spring runoff. Terra Daily has previously examined how heat and poor water clarity squeeze eelgrass habitat from both directions.
VIMS is also gathering a different kind of baseline through a partnership with NOAA. The shallow-water mapping program collects depth data during research trips and derelict-crab-trap removal, including in water six feet deep or shallower where reliable measurements have been scarce. VIMS says the project has already generated millions of bathymetric data points.
Bathymetry, aerial imagery and genetic sampling can describe parts of the system that a bottom trawl cannot. None makes the five-minute tow obsolete. The trawl’s value lies in its direct, repeated observation of which animals were present, how large they were and what the water around them was like.
The next five-minute tow
The survey has endured because its core measurement remains comparable, not because every detail stayed fixed. That is also the logic behind other long-running ecological programs, including Terra Daily’s account of seven decades of adaptive sea lamprey control in the Great Lakes. Long records can absorb carefully documented improvements while preserving the thread that makes past and present measurements comparable.
A modernized research vessel now carries the Chesapeake trawl crew, and a five-year funding cycle gives the program more stability. “Now we can breathe easier, do our work and plan for the future,” Fabrizio said. “We’ve come a long way.”
The boats remain classrooms as well as sampling platforms. Graduate students sort croaker, spot, hogchoker, flounder and other animals while learning how a field observation becomes a durable data point. Their work extends a record that began before electronic measuring boards, satellite navigation and environmental DNA entered the surveyor’s toolkit.
On the next scheduled run, the net will settle onto the bottom and move for five minutes before the winch brings it back. Someone will separate the catch, call out species and lengths, and save another set of measurements beside observations made decades earlier. The deck will be wet, the fish will be returned to the Bay, and the record will become one tow longer.
